
Pentest Management Maturity Model White Paper: 2027 Benchmark
Hisham Mir
October 9, 2026
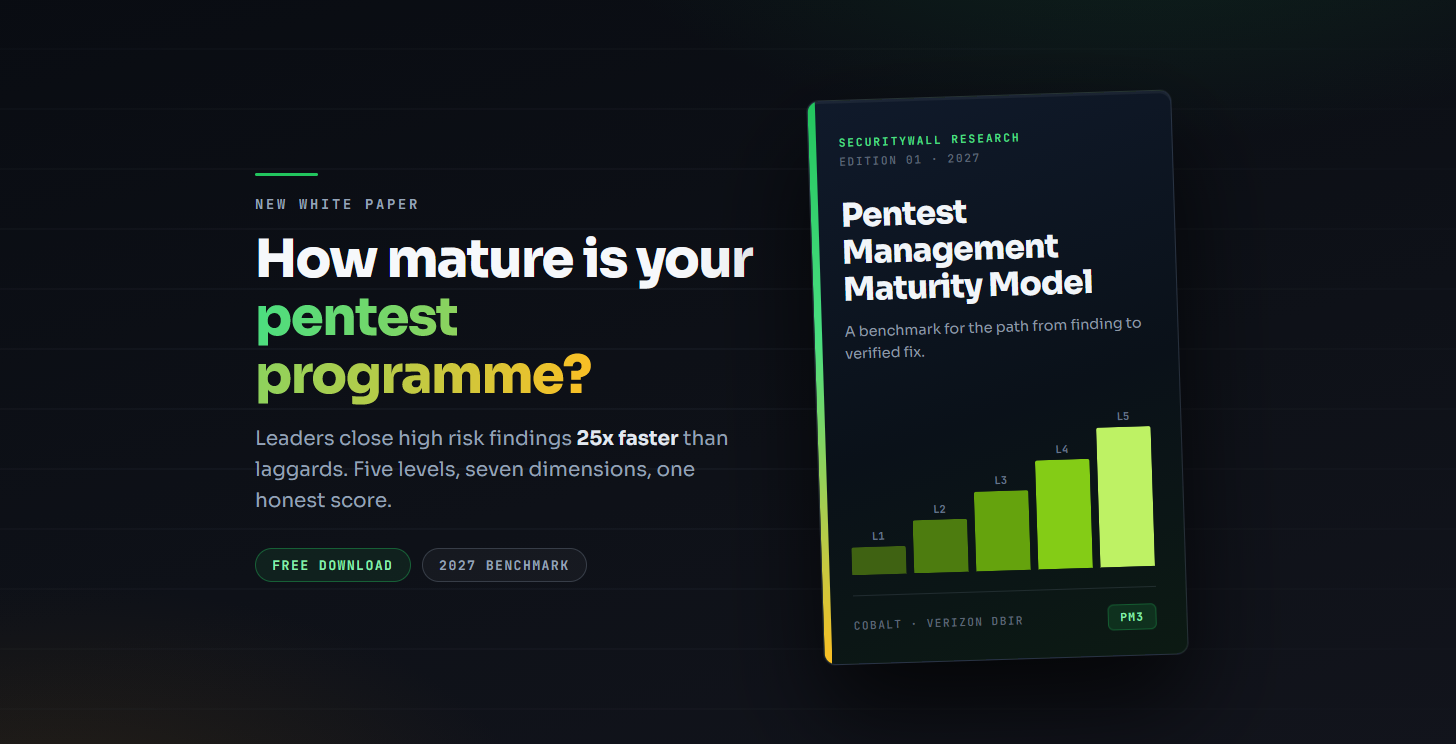
PM3 is an open framework, published by SecurityWall and free to use, cite, adapt and build on. No licence, no certification body, no fee. Consultancies are welcome to score clients with it, GRC teams to benchmark against it, and other vendors to map their products to its levels. We would rather the category had a shared vocabulary for remediation maturity than keep one to ourselves.
We built it because our clients kept asking the same question and the industry had no answer: how do we know whether our pentest programme is actually good? Maturity models exist for vulnerability management, for SOC operations, for application security. None of them scores the path from a finding to a verified fix, which is where the 2026 data says every programme is now losing.
One commitment. PM3 scores a programme, not a product: a team can reach Level 5 on tooling we do not sell. Our own platform appears in the paper as a worked example, which is a commercial interest we are stating plainly rather than burying.
Top-performing security teams resolve half their high-risk pentest findings in 10 days. The bottom tier takes 249 days. That is a 25x gap, and Cobalt's 2026 data says it is driven by programme structure rather than headcount or budget.
Most leadership teams believe they are in the first group. Cobalt found 57 percent of security leaders think their remediation SLAs are being met. Among practitioners doing the work, 15 percent agree. A 42 point gap between the people reporting upward and the people doing the fixing.
PM3 is a five level model for finding out which group you are actually in. Document, Portal, Integrated, Closed loop, Continuous. The blog explains the shape of the model. The white paper contains the seven dimension matrix, the scoring bands, the 2027 metric targets and a 90 day plan to move up one level.
Finding vulnerabilities is no longer the hard part
For twenty years the security industry optimised for discovery only. More scanners, more testers, more coverage. That problem is now solved, and solving it has broken something downstream.
Anthropic's Project Glasswing is the clearest demonstration. Claude Mythos Preview, running across partner codebases from April 2026, surfaced 23,019 vulnerabilities, roughly 6,202 of them rated high or critical. Independent firms validated around 90 percent of a sampled subset as genuine. It found a 27 year old flaw in OpenBSD and a 16 year old flaw in FFmpeg that five million automated test executions had missed.
Fewer than 1 percent have been patched.
When Anthropic updated its disclosure ledger in August, researcher Patrick Garrity found 26,153 total findings with 2,736, about 10.5 percent, reaching the ledger at all. The bottleneck was not discovery or even validation. It was human triage: deciding what matters, how bad it is, and whether to fix it.
This is not an open source curiosity. The same asymmetry shows up in enterprise data.
| Metric | Prior Year | 2026 DBIR | Direction |
|---|---|---|---|
| Median time to fully patch | 32 days | 43 days | 34 percent slower |
| CISA KEV fully remediated | 38 percent | 26 percent | Down 12 points |
| Vulnerability exploitation as initial access | 20 percent | 31 percent | Now the top vector |
| Median CVE publication to exploitation | 10 days | 5 days | Half the window |
| KEVs hitting the median organisation | 11 | 16 | More to triage |
Verizon 2026 Data Breach Investigations Report, published 20 May 2026, covering incidents from November 2024 to October 2025. Analysis of more than 22,000 confirmed breaches across 145 countries, with vulnerability data enriched by Tenable Research.
Read the first and last rows together. Exploitation now begins a median of five days after a CVE is published, while the median organisation takes 43 days to finish patching. Discovery accelerated. Remediation went backwards. For the first time in the DBIR's nineteen year history, exploitation has overtaken credential abuse as the leading way breaches start.
Basis — Glasswing figures from Anthropic's disclosure ledger as analysed by VulnCheck's Patrick Garrity, reported by TechTarget, October 2026, and from Cloud Security Alliance research notes, May and June 2026. DBIR figures from Verizon, 20 May 2026.
The 25x gap between programmes that test and programmes that close
Cobalt's 2026 State of Pentesting Report, drawing on five years of pentest data and a survey of around 450 security leaders and practitioners, measured the spread directly. It uses half-life rather than mean time to resolution, because MTTR only counts the findings you already fixed and quietly ignores the ones still open.
| Measure | Top Performers | Bottom Tier |
|---|---|---|
| High-risk finding half-life | 10 days | 249 days |
| Extra exposure window | Baseline | Roughly eight additional months |
| Critical findings closed in 3 days or less | 45 percent | 10 percent |
| Median high-risk resolution, all organisations | 39 days, against SLA targets commonly set at 7 days | |
| Five year total resolution rate | 52 percent of all findings ever resolved | |
Cobalt State of Pentesting Report 2026, analysing roughly 5,000 penetration tests per year over five years plus a survey of about 450 security leaders and practitioners conducted by Emerald Research. Half-life is the number of days to resolve 50 percent of findings, counting those still unresolved.
Two numbers in that table deserve more attention than the headline 25x.
Fifty-two percent. Across the full five year dataset, roughly half of every pentest finding ever raised remains unresolved. Not deprioritised with a documented risk acceptance. Simply open.
Forty-five percent versus ten percent. Cobalt attributes this to programme structure rather than spending. Organisations running continuous, integrated testing are 4.5 times more likely to close critical findings inside three days than organisations treating pentesting as a compliance event.
Then there is the perception problem, and it is the reason a self-assessment model is worth building at all. Fifty-seven percent of security leaders believe their remediation SLAs are being met. Fifteen percent of practitioners agree. Leadership is not lying. It is reading dashboards built from the subset of findings that already closed.
Most teams genuinely do not know which group they are in. That is the gap PM3 exists to close.
The PM3 white paper contains the full seven question self-assessment, the scoring bands, and 2027 metric targets for each level. Find out where your programme really stands.
Download the PM3 white paper →Introducing the Pentest Management Maturity Model
PM3 scores a penetration testing programme across seven dimensions on a five level scale. The dimensions cover how findings travel from a tester to the engineer who fixes them, how closure is verified, and how quickly evidence can be produced for an auditor. The paper sets them out in full.
The five levels describe what most organisations will recognise immediately.
Two things about the levels are worth stating plainly.
Level 3 is where most funded companies sit, and it feels like success. Jira integration is working, findings appear in sprints, dashboards look healthy. The gap is verification: nobody can prove the fix worked without booking a tester, so closure is asserted rather than evidenced.
You cannot buy a level. Tooling moves you from 1 to 2 and helps from 2 to 3. Moving to 4 and 5 is a process change: who owns a finding, what closure means, and whether the programme measures verified fixes rather than tickets marked done.
One prediction from the paper, offered here in full: verified-fix rate becomes a board reported metric during 2027. Finding counts stop being credible the moment a board member asks how many were confirmed fixed.
Three questions that reveal your real maturity level
The full assessment is seven questions with scoring bands. These three are the ones that most often move a team's self-estimate downward.
- Time to engineer visibility. From the moment a tester confirms a high-risk finding, how long until the engineer who owns that code can see it without anyone forwarding a document?
- Retest turnaround. Engineering marks a critical finding fixed this morning. How long until you have a verified answer on whether it actually is?
- Auditor evidence retrieval. An auditor asks for proof that last quarter's critical findings were fixed and re-verified. How long to produce it?
If any answer is measured in weeks, your programme is not at the level your dashboard suggests. The full seven question assessment and scoring bands are in the paper.
Question three is the one that separates Level 3 from Level 4, and it is also the question auditors actually ask. Across SOC 2, ISO 27001 and PCI DSS, retest evidence is the most commonly missing artifact in an evidence pack. Our guide to ISO 27001 and SOC 2 penetration testing covers why a report with open criticals and no verification reads worse to an auditor than no report at all.
What is inside the white paper
- The full seven question self-assessment with scoring bands and the level cap rule
- The seven dimension maturity matrix, scored across all five levels
- 2027 metric targets by level, so you know what good looks like at your stage
- A 90 day plan to move up one level, with gates at each step
- A regulatory evidence map covering SOC 2, ISO 27001, PCI DSS, DORA, NIS2, GDPR, HIPAA, NCA ECC, SAMA and NESA
- Role guidance for CISOs, engineering leads, GRC and MSSPs
- A worked example of one organisation moving from Level 2 to Level 4
- Eight predictions for 2027
Who should read it
CISOs planning 2027 budgets. PM3 converts "we need better pentest tooling" into a current level, a target level, and the specific dimensions that have to move. That is a defensible budget line rather than a preference.
Heads of offensive security. The seven dimensions are a diagnostic. Most programmes score unevenly, strong on testing depth and weak on verification, and the matrix shows exactly where.
GRC leads facing an audit. The regulatory evidence map tells you which artifact each framework expects and at which level your programme can reliably produce it.
Consultancies and MSSPs. PM3 works as a client-facing benchmark. Scoring a client at Level 2 and showing them what Level 4 looks like is a more productive conversation than selling another annual test. If you are also evaluating the tooling layer, our PlexTrac alternatives roundup compares the platforms on sourced pricing, and SLASH is the platform used as the worked example in the paper.
Frequently asked questions
What is a pentest management maturity model? A framework for scoring how well an organisation handles penetration testing findings after the test ends: how findings reach engineers, how fixes are verified, and how fast closure evidence can be produced. It measures the remediation half of the programme, which is where the 2026 data says the bottleneck now sits.
How is PM3 different from CTEM or Gartner's AEV? CTEM and adversarial exposure validation describe a broad continuous security programme across all exposure sources. PM3 is narrower and more operational: it scores one specific workflow, the path from a pentest finding to a verified fix. They are complementary. PM3 measures whether the validation step in a CTEM loop actually closes.
What level should a regulated organisation target in 2027? Level 4, closed loop, because it is the first level at which retest evidence is retrievable on demand rather than reconstructed. That is the capability auditors under SOC 2, ISO 27001, PCI DSS and DORA ask for and most programmes struggle to produce. The paper gives per framework targets.
Why do auditors care about retest evidence? Because a finding marked resolved without verification is an assertion, not evidence. A report listing open critical findings with no closure record is a documented, unremediated risk. Under PCI DSS requirement 11.4, retest of exploitable findings is explicit.
Is the PM3 white paper free? Yes. It is gated behind a short form asking for name, work email, company and role. No payment, no sales call required to read it.
Is PM3 tied to a specific platform? No. PM3 scores a programme, not a product, and a team can reach Level 5 on tooling we do not sell. SecurityWall built the model and SLASH appears in the paper as a worked example, which is a commercial interest we are stating openly rather than hiding. The assessment questions do not reference any vendor. For context on the wider tooling market, our PTaaS guide and SLASH versus PlexTrac comparison both name competitors directly.
Download the PM3 white paper
Five levels, seven dimensions, the full self-assessment, and a 90 day plan to move up one level. Free, gated behind a short form.
Download the white paper →If an auditor asked tomorrow for proof that last quarter's critical findings were fixed and re-verified, how long would it take your team to produce it? If the honest answer is more than a day, you are likely at Level 2 or 3, and your next penetration test will add to the backlog rather than reduce it.
In a 30 minute scoping call we will map your last pentest against the seven PM3 dimensions and show you where the gap is. Not ready to talk? The free SOC 2 readiness assessment covers adjacent ground.
Book a scoping call →Sources
| Claim | Source |
|---|---|
| 10 day versus 249 day half-life, the 25x gap | Cobalt, State of Pentesting Report 2026 |
| 57 percent of leaders versus 15 percent of practitioners on SLAs met | Cobalt, AI and Pentesting Pulse Report 2026 |
| 4.5x programmatic advantage, 45 percent versus 10 percent | Cobalt, State of Pentesting Report 2026 |
| 52 percent five year resolution rate, 39 day median | Cobalt, State of Pentesting Report 2026 |
| Median patch time 32 to 43 days, KEV remediation 38 to 26 percent | Verizon Data Breach Investigations Report 2026, 20 May 2026 |
| Exploitation at 31 percent of breaches, 5 day exploitation median | Verizon DBIR 2026, with Tenable Research data |
| 23,019 Glasswing findings, fewer than 1 percent patched | Anthropic disclosure ledger, via Cloud Security Alliance and TechTarget |
| 26,153 findings, 10.5 percent reaching the ledger | VulnCheck analysis by Patrick Garrity, reported October 2026 |
No figure on this page is SecurityWall data. PM3 is our framework; the evidence it is built on is not ours. Last reviewed October 2026.
Tags
About Hisham Mir
Hisham Mir is a cybersecurity professional with 10+ years of hands-on experience and Co-Founder & CTO of SecurityWall. He leads real-world penetration testing and vulnerability research, and is an experienced bug bounty hunter.