Free Nessus Report Visualizer: Instantly Understand Your Nessus Scans
Babar Khan Akhunzada
January 1, 2026
After running a Nessus scan, most teams face a common frustration: the exported .nessus XML or JSON file is huge, hierarchical, and nearly impossible to read without specialized tools. Analysts often find themselves scrolling through thousands of lines of raw XML, reading the report and trying to locate the critical vulnerabilities that matter most.
Many teams attempt workarounds like exporting CSVs or PDFs, but these formats have limitations. Static tables or flat reports make it hard to see trends, compare hosts, or quickly prioritize remediation tasks. Even the built-in Nessus HTML reports, while visually nicer than raw XML, rarely provide the interactivity needed for effective vulnerability triage at scale as nessus reports are not client ready.
Pain point: Raw Nessus output is structured for machines, not humans. Without proper visualization, important findings can be overlooked, and remediation becomes slower and more error-prone.
That’s why the SecurityWall Nessus Report Visualizer is an essential tool for pentesters, SOC teams, and IT managers. It turns raw Nessus reports into clear, actionable insights in minutes, saving hours of manual work.
2. Problems With Large XML/JSON Nessus Files
Analysts working with raw Nessus files encounter several technical headaches that make vulnerability management a challenge:
Huge file sizes — Full enterprise scans can produce XML files that are tens or even hundreds of megabytes. Trying to load or parse these in Excel or a text editor can freeze machines or crash applications, forcing teams to pre-filter their data before analysis.
Redundant or repeated data — The same vulnerability may appear across multiple hosts or ports, creating repetitive entries that clutter reports. Sorting through this noise to find unique issues is time-consuming and frustrating.
Difficult prioritization — With hundreds or thousands of findings, it’s often unclear which issues should be addressed first. Medium or low-severity findings can distract from critical vulnerabilities, and without filtering or interactive sorting, teams struggle to focus their remediation efforts effectively.
False positives and false negatives — Nessus, like any automated scanner, can produce false alarms or miss some vulnerabilities. Analysts need context and clear severity interpretation to make informed decisions, but raw reports rarely provide this clarity.
Tools like the SecurityWall Nessus Report Visualizer solve these problems by providing interactive charts, host/service drilldowns, filtering, and export options. Combined with our pentesting services and expertise, teams can turn raw scan results into actionable security insights quickly and efficiently.
Nessus Report Visualizer vs Raw Nessus Exports
| Infosec Management Concern | Raw Nessus Exports | Nessus Report Visualizer |
|---|---|---|
| Time to understand results | High — requires analyst interpretation | Low — risks visible immediately |
| Visibility of critical risk | Buried among large volumes of findings | Critical and high issues surfaced first |
| Decision-making support | Hard to prioritise without explanation | Clear prioritisation for action |
| Reporting to leadership | Static, technical, hard to consume | Clear summaries for executive review |
| Audit & compliance readiness | Manual mapping and justification | Easier extraction of relevant evidence |
| Overall confidence in results | Lower due to noise and complexity | Higher due to clarity and context |
3. What a Visualizer Does — Making Sense of Nessus Fast
A Nessus report visualizer transforms hours of tedious work into minutes of actionable insights. Instead of manually parsing massive XML or JSON files, it turns raw scan data into a clear, interactive interface that both technical teams and managers can use.
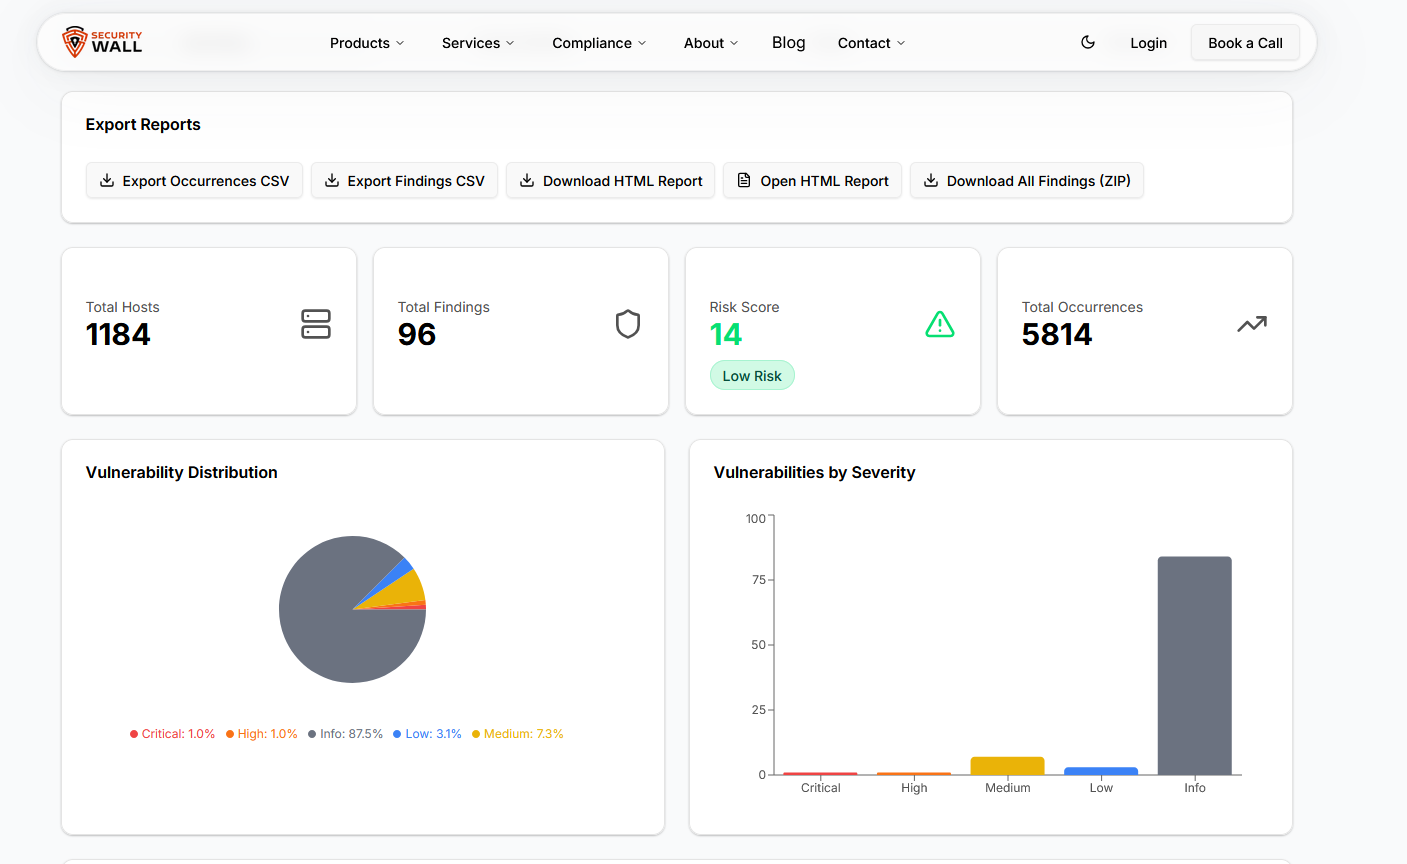
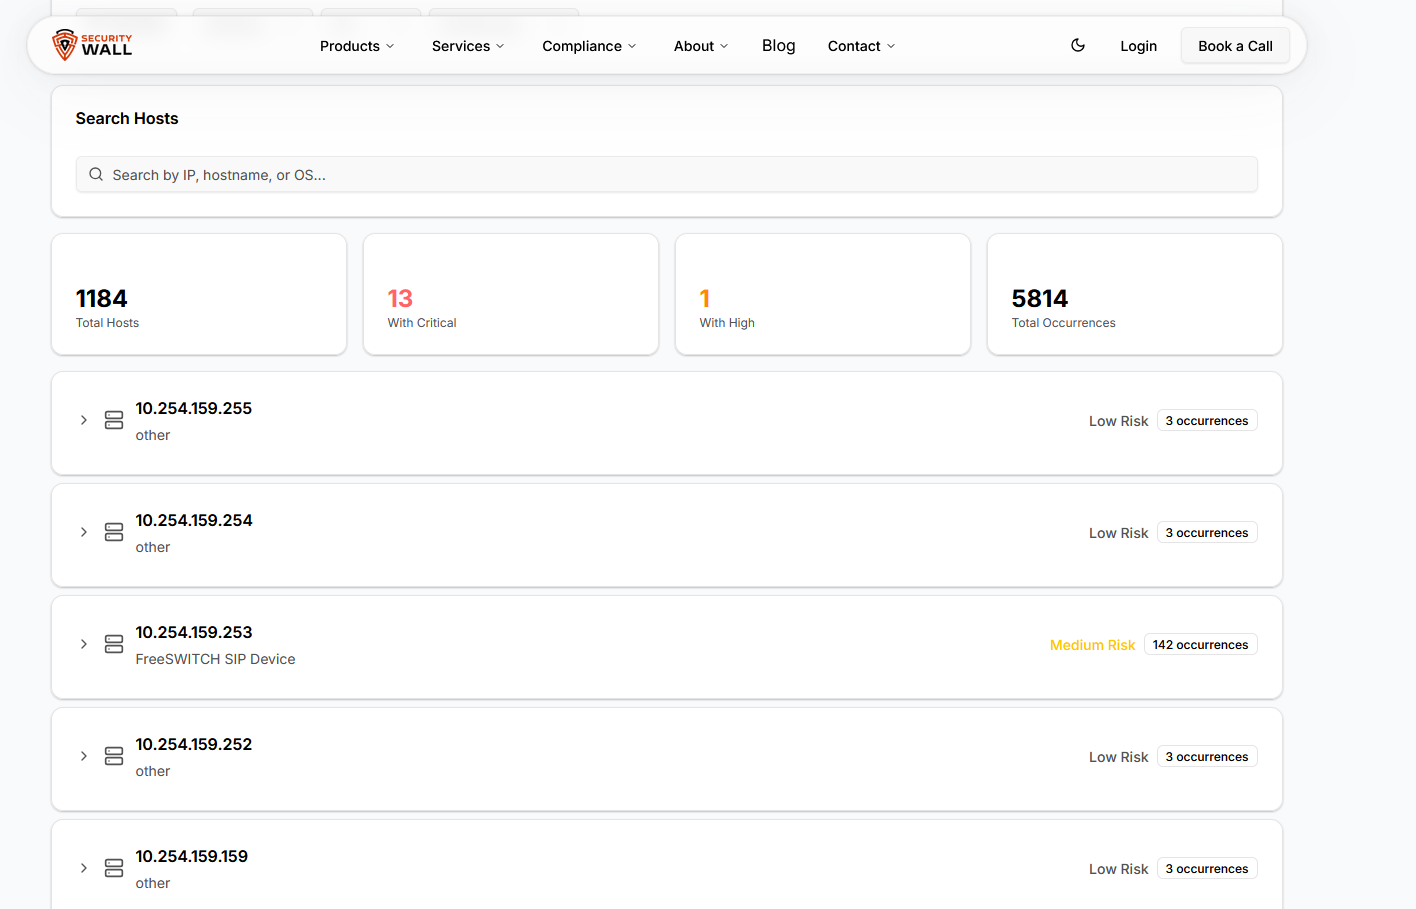
Charts and summary views – Vulnerabilities are grouped by severity, host, or service, allowing analysts to immediately see where critical issues lie. What used to take a deep dive into hundreds of lines of XML now appears at a glance in bar charts, pie charts, or heatmaps.
Interactive filters – Analysts can filter by severity, host, port, protocol, or service name, instantly reducing noise and focusing on the vulnerabilities that matter most. This eliminates the frustration of scrolling endlessly through repeated or low-priority findings.
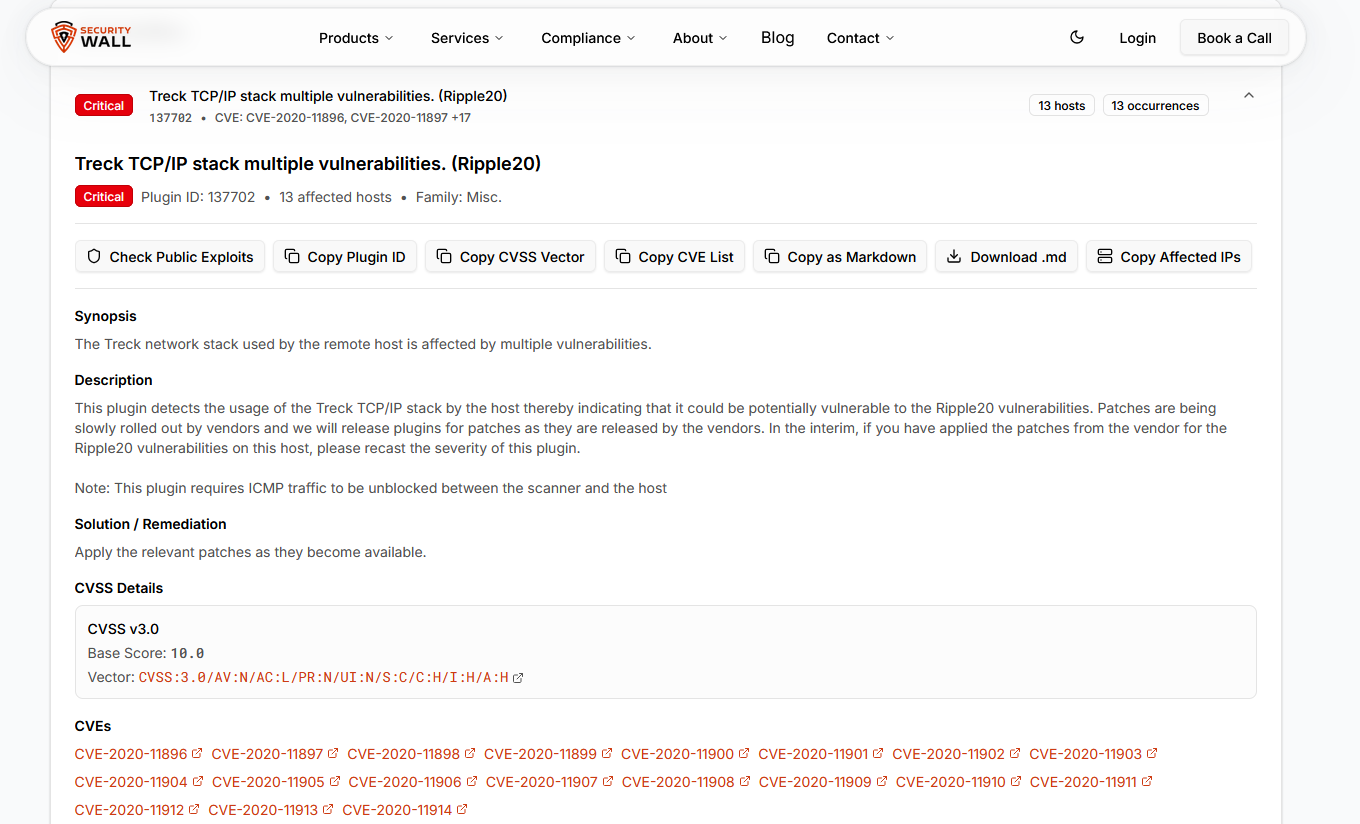
Host and service drilldowns – Clicking into a host or service reveals all associated vulnerabilities with plugin IDs, CVSS scores, and detailed descriptions. Teams can quickly prioritize remediation on a per-host basis without juggling multiple CSV exports.
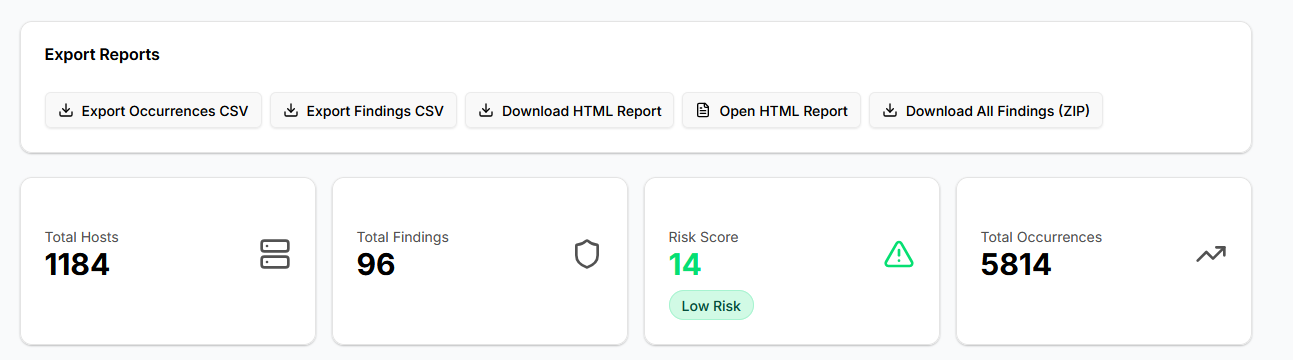
Export-ready outputs – Once findings are analyzed, they can be exported as CSV, Markdown, HTML reports, or ZIP archives. This ensures reports are professional, actionable, and easy to share with management, auditors, or clients.
Quick remediation actions – Analysts can copy host:port targets for verification scans or quickly check known exploits, streamlining the vulnerability management workflow.
By converting complex Nessus reports into intuitive, actionable dashboards, a visualizer reduces human error, speeds up remediation, and helps teams focus on what truly matters: protecting their organization from real threats.
With the SecurityWall Nessus Report Visualizer, teams can turn raw, overwhelming Nessus data into actionable intelligence instantly. Combined with our pentesting services and SLASH platform, organizations gain a complete view of their security posture while saving hours of manual work.
4. Key Features of the SecurityWall Nessus Report Visualizer
The SecurityWall Nessus Report Visualizer is designed around real-world problems security teams face when handling Nessus output, not around cosmetic reporting. Nessus Was Built for Detection, Not Communication as explained with examples in previous resources.
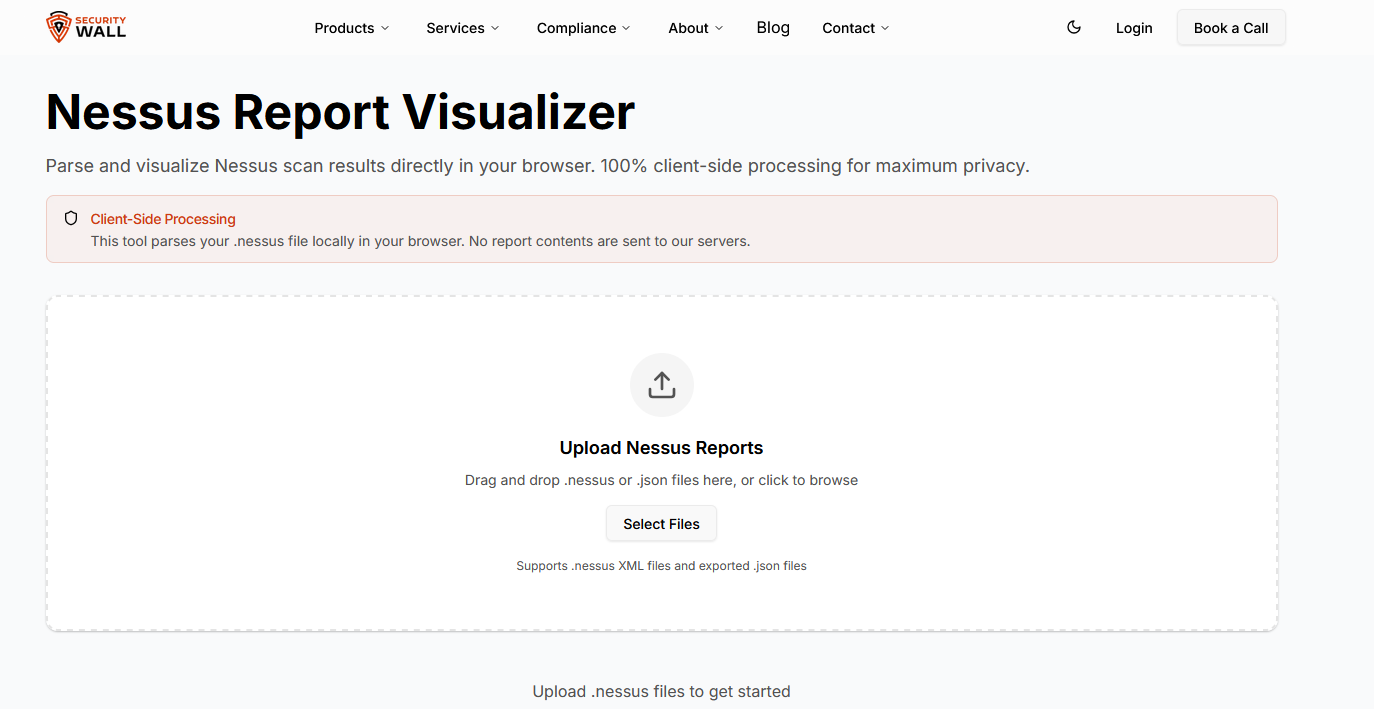
One of the most critical features is 100% client-side processing. Nessus reports often contain sensitive internal IPs, hostnames, and vulnerability data. Uploading these files to third-party servers is unacceptable for many organizations. This tool parses .nessus and .json files entirely inside the browser, ensuring that scan data never leaves the user’s system.
Handling large Nessus files is another major challenge. Enterprise scans can generate massive XML files that traditional viewers struggle with. The visualizer uses chunked parsing, allowing even large reports to be processed smoothly without browser freezes or crashes.
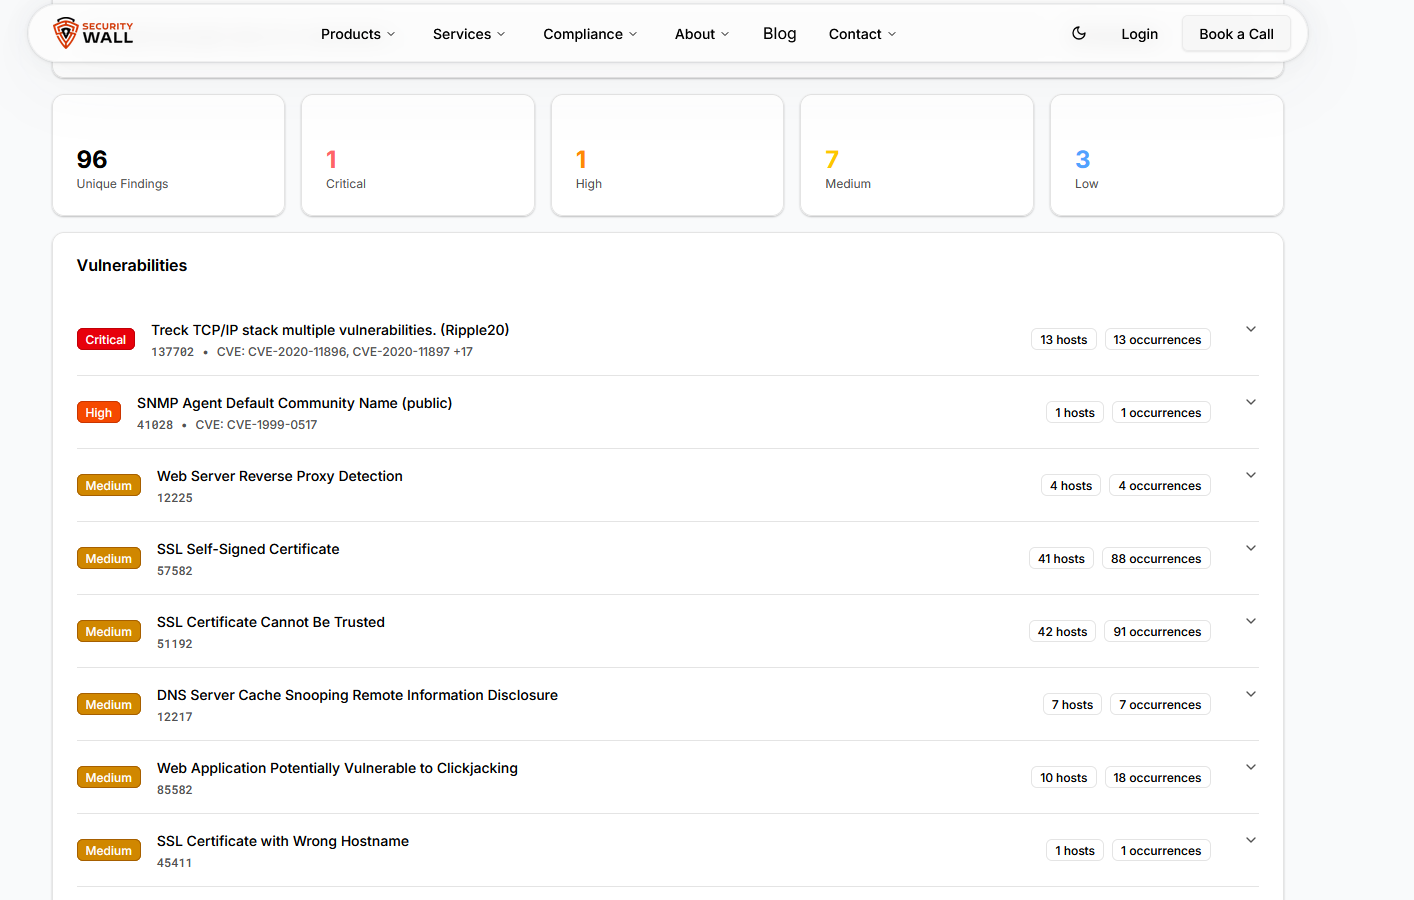
The tool provides severity-based visualization, allowing users to instantly see the distribution of Critical, High, Medium, and Low findings. Instead of manually counting vulnerabilities across hosts, teams can immediately identify where the real risk lies.
Advanced filtering and drilldowns allow users to pivot the data by host, service, port, protocol, or severity. This is essential when teams need to focus on a specific asset group or validate exposure on a particular service.
Export flexibility is built in. Findings can be exported as CSV for tracking, HTML for print-ready reports, Markdown for documentation, or ZIP archives for full offline analysis. These exports integrate cleanly with internal reporting workflows and client deliverables.
5. Who This Tool Is Built For
The Nessus Report Visualizer is not limited to a single role. It addresses the needs of multiple stakeholders involved in vulnerability management.
Pentesters benefit by reducing the time spent cleaning and restructuring Nessus output before writing reports. The tool helps identify critical findings quickly and prepares clean data that can be fed directly into final deliverables or used alongside professional pentesting services.
SOC and security operations teams use it for faster triage. Instead of scanning raw XML or static PDFs, analysts can immediately isolate high-risk hosts and services, accelerating remediation workflows.
Security managers and auditors gain access to clear summaries and visual insights without needing to interpret raw scan data. Executive-friendly exports help communicate risk without overwhelming non-technical stakeholders.
IT and infrastructure teams can quickly identify which systems are affected, on which ports, and by which services, allowing remediation to start without delay or misinterpretation.
6. Privacy and Security by Design
Nessus reports often contain information that should never be uploaded to external systems. Hostnames, internal IP ranges, service fingerprints, and vulnerability metadata are sensitive by nature.
The SecurityWall Nessus Report Visualizer processes everything locally in the browser. There is no server upload, no storage, and no logging of scan data. This design aligns with security expectations in regulated environments and high-risk industries.
For organizations that cannot use cloud-based analysis tools due to compliance or internal policy, this approach removes a major adoption barrier.
Privacy is not a feature here. It is the foundation.
7. Try the Free Nessus Report Visualizer
If you are tired of wrestling with raw Nessus XML files, static PDFs, or time-consuming manual exports, the solution is already available.
The SecurityWall Nessus Report Visualizer allows you to upload a .nessus or .json file and instantly turn it into clear, actionable security insights.
No uploads. No accounts. No data leaving your system.
For teams that need deeper assessments, structured reporting, or validation beyond automated scans, this tool pairs naturally with SecurityWall’s professional pentesting services and the broader capabilities of the SLASH platform.
Try the Free Nessus Report Visualizer now and turn raw scan data into decisions that matter.
Turn raw Nessus XML & CSV reports into clear, visual insights in minutes.
Try Nessus Report Visualizer →Tags
About Babar Khan Akhunzada
Babar Khan Akhunzada leads security strategy, offensive operations. Babar has been featured in 25-Under-25 and has been to BlackHat, OWASP, BSides premiere conferences as a speaker.